Location Performance Score: Everyone’s Measuring Local Marketing and Almost No One Can Explain What It Earns
Local marketers track everything and can prove almost nothing. Here’s how the Location Performance Score turns scattered metrics into revenue impact.

LPS is built from three subscores, each tracking one pillar of Location Performance Optimization. Visibility measures how findable each location is: profile completeness, data syncs, and connections across search platforms. Reputation reflects how trusted it is: ratings, review volume, and how reliably your team responds. Engagement captures how alive it looks: posts, photos, messages, and social activity that signal an open, active business.

Key takeaways
- Most local marketing metrics measure activity, not outcomes, which is why nearly three in four marketers can’t connect their work to sales
- Uberall’s Location Performance Score (LPS) consolidates visibility, reputation, and engagement into one standardized, benchmarked metric that tells you what to fix next
- Paired with the Revenue Estimator, LPS translates those improvements into measurable revenue impact in dollars and cents
Shoot for the stars; aim for the moon. That’s a saying I could always get on board with.
But in local marketing today, it often feels more like “Shoot for task completion; aim for anything that resembles progress.”
Nearly three in four marketers still struggle to connect location marketing efforts to sales. They’re scrappily stitching together incomplete, unclear, or disconnected data from multiple dashboards, and they don’t know which benchmarks they should shoot for.
Even if they know they’re doing many things right — optimizing Google Business Profiles, managing reviews, and running localized social campaigns — this blindness around business impact is very wrong. They know that.
That blindness is exactly why we built the Location Performance Score (LPS) in our users’ dashboards: one single metric that shows them where their locations stand, what to fix next, and what that work is worth.
Different Metrics, Different Dashboards, and Still No Answer
No one’s jaw is dropping when I say that 61% of CMOs and VPs at multi-location brands describe their workload — tracking AI visibility, managing listings, monitoring reviews, posting local content — as “complex” or “very complex.”
These marketing leaders are often tracking plenty of local marketing metrics. These include:
- Local search visibility (or rankings): How prominently does your brand or location appear in local search results — both AI and traditional search?
- Local conversion rate: How many online interactions — like clicks, calls, or direction requests — lead to visits or sales?
- Cost per local lead: What’s the cost of acquiring a potential customer through local marketing?
- Return on ad spend (ROAS): Are your local ads generating enough revenue to justify the investment?
- Local customer lifetime value (CLV): How much long-term revenue does a customer bring in after engaging locally?
Each of these metrics is useful; the problem is that none of them is enough. A brand might rank impressively in AI search and still see empty stores, because visibility only measures whether people find their store — not whether customers show up and spend money. Think of a coffee chain whose downtown store tops every “coffee near me” search yet still has no line at the counter. Or the location in the city center with an impressive conversion rate: 8 out of 10 profile visits end in a click-to-call, but only 50 people viewed the profile all month.
And to add to that, marketing leaders need to know which of their team’s improvements and which locations are driving real business outcomes. Most can’t say what any achievement is worth in dollars and cents: Proving it is often harder than the work of actually improving it — and just as important.
“Before LPS, managing local visibility was like solving a puzzle in the dark. We could point to isolated wins — a spike in rankings here, a high conversion rate there — but we were fundamentally blind to how those pieces connected to foot traffic and revenue. We were drowning in search data but starving for actual business insights.” – Pradip Lal, Senior Product Marketing Manager
That’s exactly what Uberall’s Location Performance Score (LPS) is designed to change.
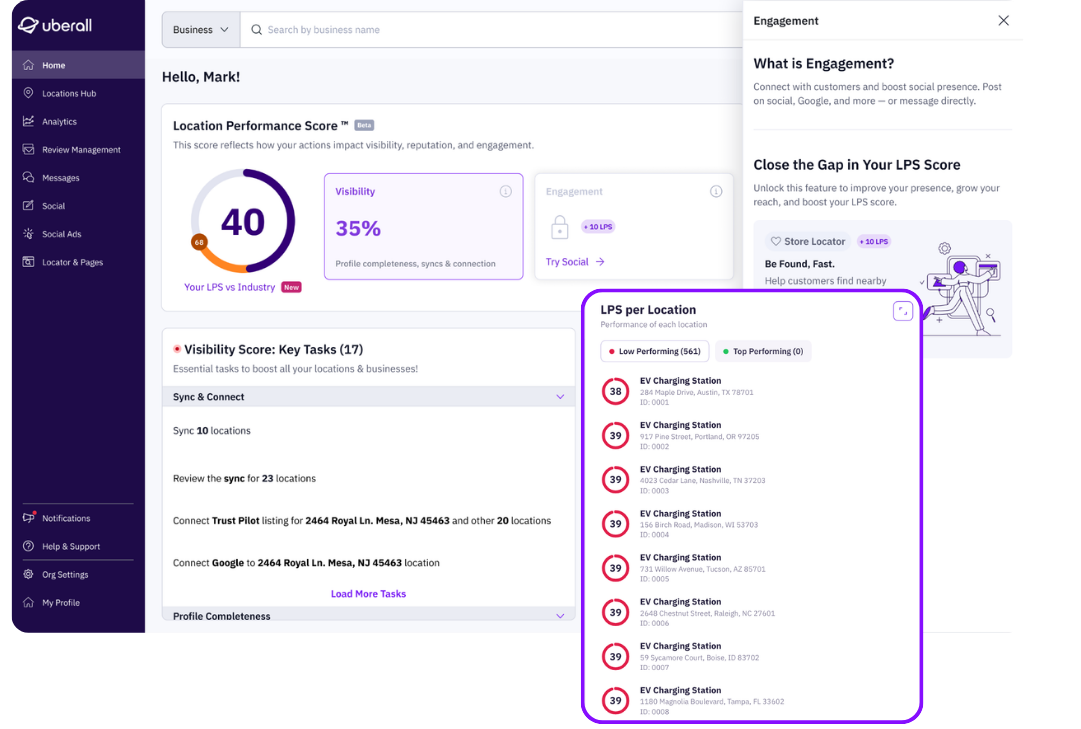
LPS consolidates visibility, reputation, and engagement into one standardized score for every location.
It makes it easier to compare locations, identify underperformers, and apply what’s working elsewhere — all while tracking progress over time. Because when metrics are transparent and standardized, marketers can finally track growth with confidence just from their dashboard.
LPS goes beyond internal tracking. It helps our users understand how their brand stacks up in the market — across their competitors and entire industries — from retail and financial services to hospitality.
By benchmarking against similar businesses, marketing teams can spot performance gaps early, move faster than competitors, and focus their resources where they’ll make the biggest impact.
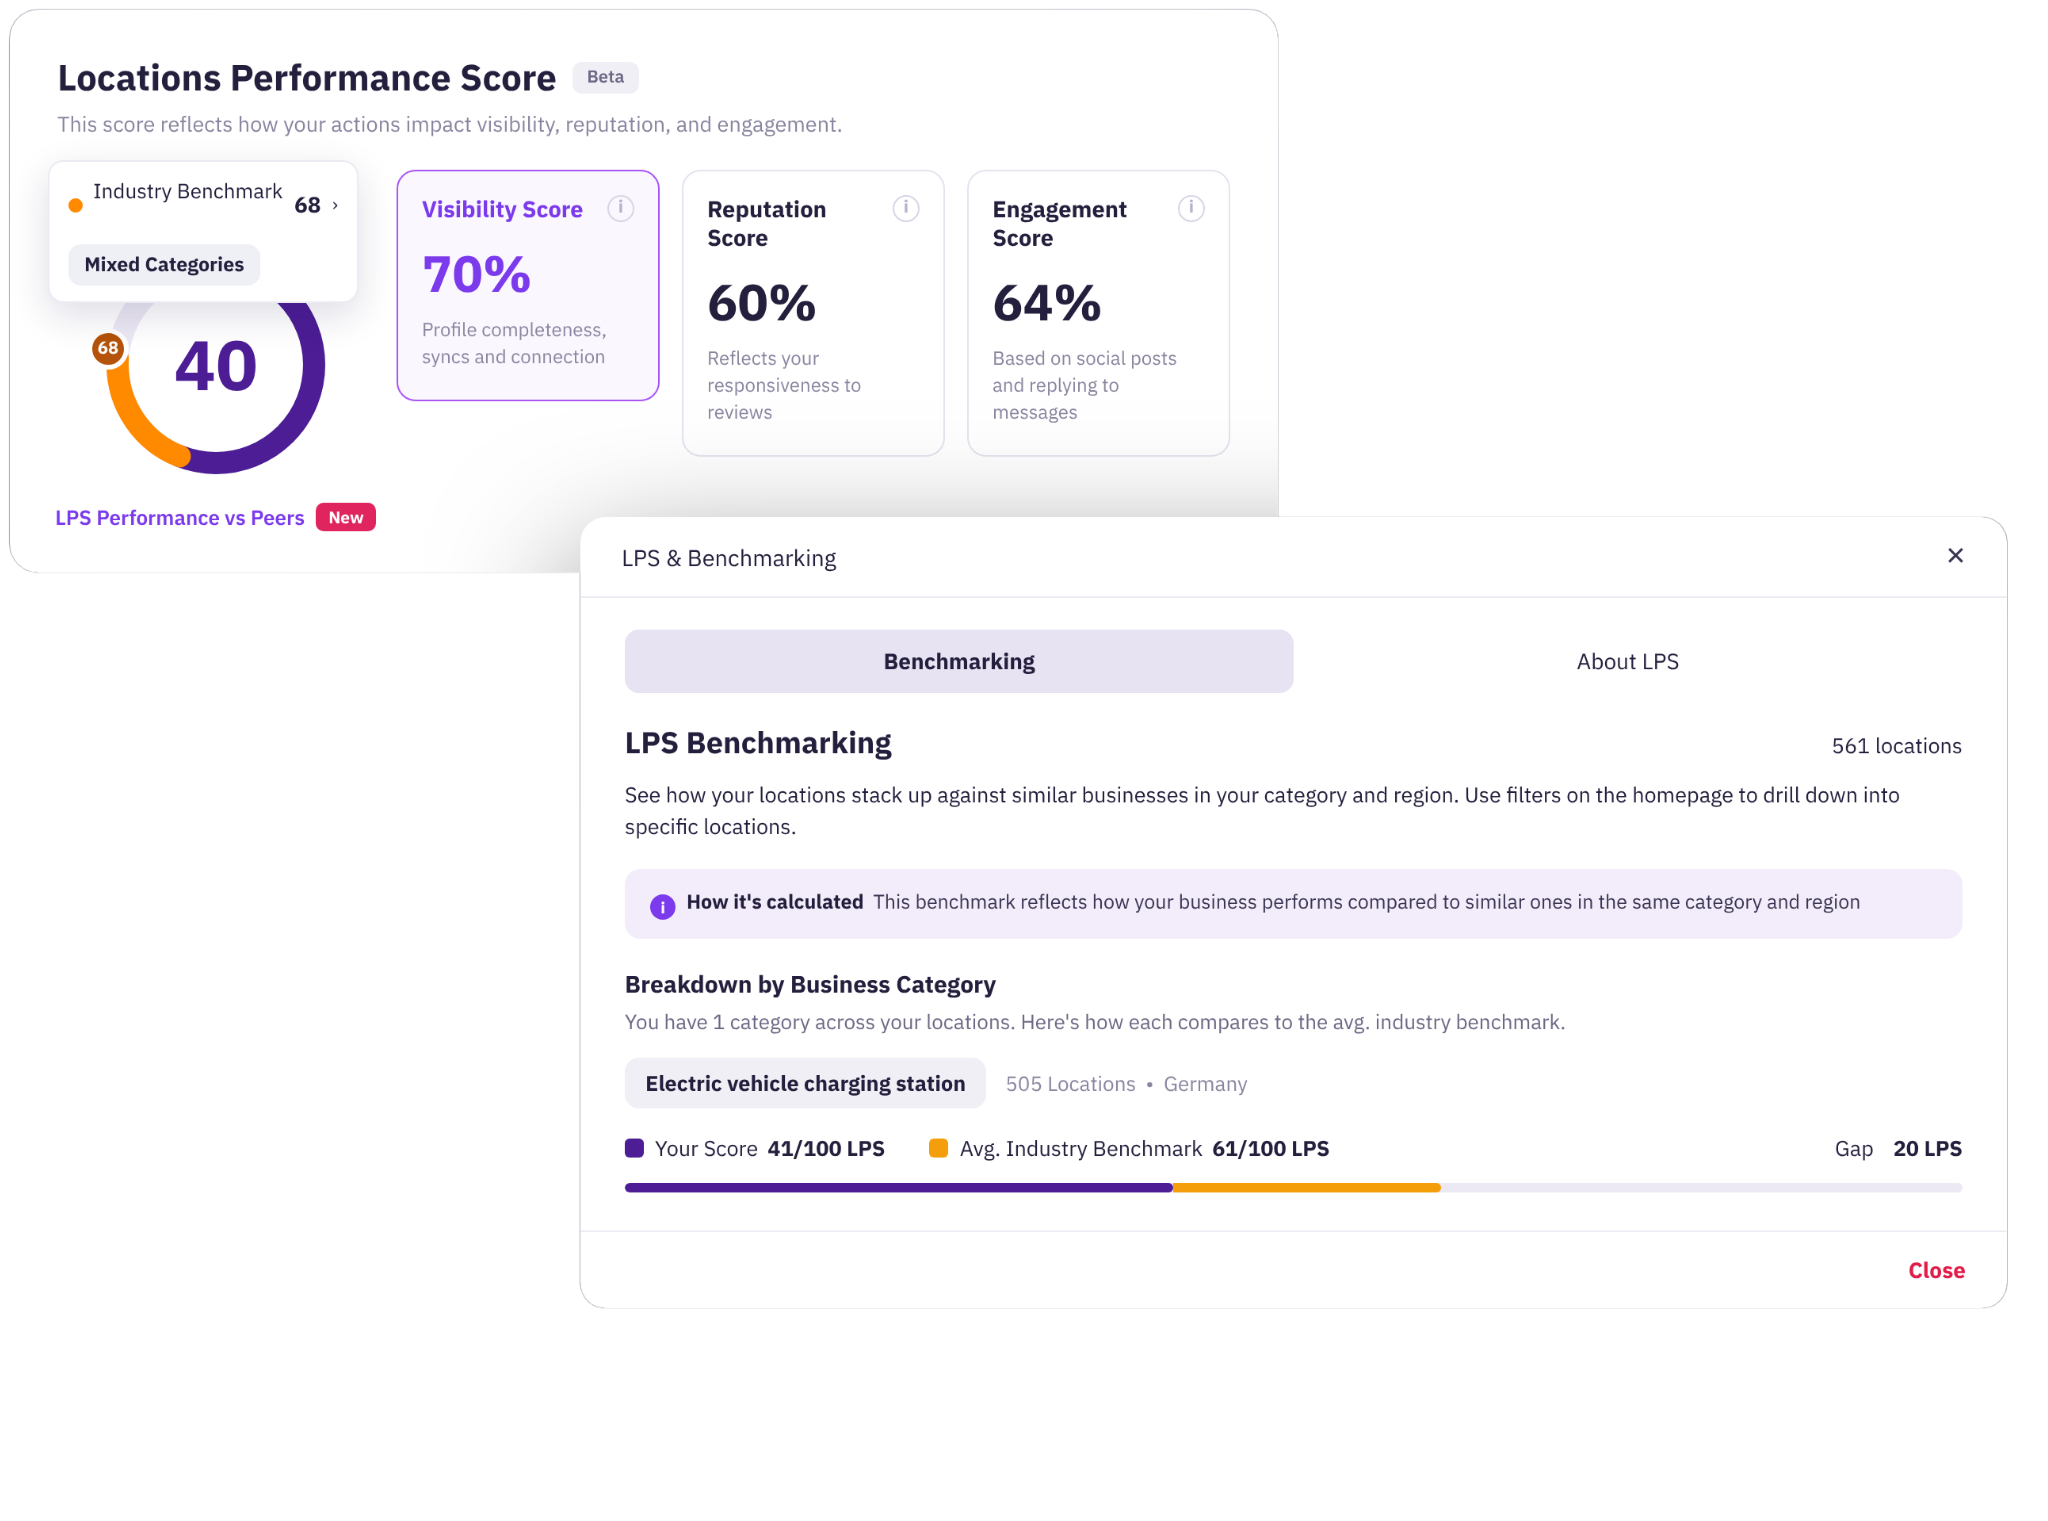
And FYI, a low score isn’t a red flag — it’s a roadmap for opportunities, revealing where to refine a local marketing strategy, strengthen review responses, or elevate the customer experience.
Location Performance Score Becomes a Brand’s Dollars and Cents
Here’s what prospects tell us frustrates them most: Attribution. Validation for their work.
Putting a dollar figure on local marketing performance is, in the words of one retail marketer we spoke with, “a big challenge” … and that’s the understated version.
{{quote}}
LPS is built from three subscores, each tracking one pillar of Location Performance Optimization. Visibility measures how findable each location is: profile completeness, data syncs, and connections across search platforms. Reputation reflects how trusted it is: ratings, review volume, and how reliably your team responds. Engagement captures how alive it looks: posts, photos, messages, and social activity that signal an open, active business.
This so-called big challenge is assigned to our in-platform Revenue Estimator to solve, which works alongside LPS. It takes actual listings click data, applies benchmark conversion assumptions — clicks to visits, visits to purchases, average sale value — and estimates the revenue a team’s local marketing efforts generate.
“With the integration of LPS and the Revenue Estimator, clients can instantly translate operational optimization into projected financial impact. Instead of pitching abstract search metrics, marketing leaders use this data to present a clear, dollar-for-dollar business case that directly justifies and secures their local marketing budget.” – Pradip Lal, Senior Product Marketing Manager at Uberall
This is how large enterprise and franchise teams put numbers behind work that used to be invisible. Our client Pizza Hut tracks a 15% increase in estimated revenue impact across 387 locations — alongside a 212% lift in Google Maps impressions — while Barceló Hotel Group measured a 56% revenue increase from local SEO within its first eight months on the platform.
What does that mean for marketing teams using the Uberall dashboard? The score shows where every location stands, and the recommendations show what to do next — add call-to-action buttons to Locator Pages, add special opening hours to a Google Business Profile — and the Revenue Estimator shows what doing it was worth.
Your visibility, reputation, and engagement scores matter enormously inside your team; the Revenue Estimator translates them for everyone outside it.
This transparent closed loop is what keeps task prioritization honest. When a revenue signal accompanies every task, “What should we work on?” stops being a debate and starts being a list. And as scores get higher, teams get clear-as-day proof their efforts are paying off — and from that proof comes momentum, confidence, and more ideas to test.

What Gets Scored Gets Funded and Helps Teams Prioritize
Revenue is already flowing through your locations. The only question is whether you can see it, and whether leadership can see what’s driving it. The guessing game is one marketing teams can never afford to play.
As marketing complexity grows, so does the pressure to prove ROI with more than impressions and website traffic. Teams seriously need reliable performance benchmarks they can trust, and transparent attribution to their bottom line.
Because teams that can show where they stand, what they fixed, and what it earned will keep winning budget to keep doing what they’re doing. Teams that can’t will keep explaining scrappily stitched-together data from multiple dashboards, with no idea what benchmarks to shoot for in their industry.
In a world where marketers are expected to do more with less, aiming higher starts with knowing where you stand. LPS gives you the starting point, the priority list, and the proof — one location at a time, across hundreds or thousands of them.



1,800 brands trust us to stay visible
— not just show up once or twice in local search.





.png)

Frequently asked questions
A Location Performance Score (LPS) is a single, benchmarked metric that consolidates a location’s visibility, reputation, and engagement into one number. Visibility measures how findable each location is across search platforms. Reputation reflects ratings, review volume, and response rates. Engagement captures social activity, posts, and messages. LPS helps teams identify which locations need attention and where small improvements will have the biggest revenue impact.
It’s hard to prove local marketing ROI because most local marketing metrics measure activity — rankings, clicks, impressions — rather than business outcomes like revenue and foot traffic. Nearly three in four marketers still struggle to connect location marketing efforts to sales, according to Uberall's research. Teams end up stitching together incomplete data from multiple dashboards without knowing which benchmarks to aim for and proving the value of their work becomes as hard as the work itself.
The Location Performance Score is calculated from three weighted subscores, each tracking one pillar of Location Performance Optimization. The visibility subscore measures profile completeness, data syncs, and connections across search platforms. The reputation subscore tracks ratings, review volume, and review response reliability. The engagement subscore captures posts, photos, messages, and social activity. Each component contributes to a weighted total out of 100 that reflects the overall health of a location’s online presence.
Tracking marketing activity means measuring what your team did — posts published, reviews responded to, listings updated. Tracking marketing outcomes means measuring what that work produced — foot traffic, calls, direction requests, and revenue. Most local marketing dashboards default to activity metrics, which is why teams can show they did the work but can’t show what it was worth. A score-based approach like LPS bridges this gap by tying every activity to a performance outcome that connects to revenue.
The Revenue Estimator works alongside LPS by taking actual listings click data — calls, direction requests, website visits — and applying benchmark conversion assumptions: clicks to visits, visits to purchases, and average sale value. The result is an estimated revenue figure tied to your team’s local marketing improvements. It’s an estimator though; it doesn’t predict the future. It gives marketing leaders a dollar-for-dollar business case for their budget.
You benchmark local marketing performance across locations by comparing each location’s LPS against others in your network, against competitors, and against industry averages. Because LPS uses the same standardized formula everywhere — visibility, reputation, engagement — a score of 72 means the same thing whether it’s a retail store in Dallas or a hotel in Barcelona. This makes it possible to spot performance gaps early, identify what’s working at top performers, and apply those wins elsewhere before competitors close the gap.
There’s no single number that defines a good Location Performance Score. What matters is where you stand relative to your industry, your competitors, and your own network. A score that looks modest in one vertical might be market-leading in another. More importantly, a low score isn't a red flag; it’s a roadmap that reveals where to strengthen review responses, improve listing completeness, or elevate social engagement. The goal is consistent upward movement, with each improvement tracked against revenue impact.
Improving your Location Performance Score affects revenue through a direct chain: Higher visibility, reputation, and engagement scores drive more calls, direction requests, and website visits — and the Revenue Estimator translates those actions into estimated dollars. Pizza Hut tracked a 15% increase in estimated revenue impact across 387 locations alongside a 212% lift in Google Maps impressions. Barceló Hotel Group measured a 56% revenue increase from local SEO within its first eight months.